skip to main
|
skip to sidebar
Brittany's Map Catalog
Wednesday, April 14, 2010
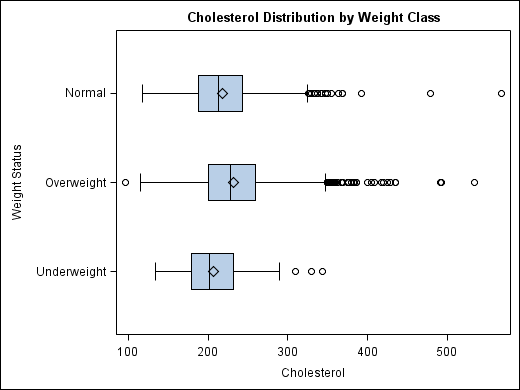
#37: Box Plot
Box plots show a detailed summary of a set of data, It shows the median, the average, and measures of dispersion. They are very useful when comparing many sets of data. This plot shows the correlation between cholesterol and weight.
No comments:
Post a Comment
Newer Post
Older Post
Home
Subscribe to:
Post Comments (Atom)
Followers
Blog Archive
▼
2010
(50)
▼
April
(42)
#50: Nominal Area Choropleth Map
#49: Univariate Choroplth Map
#48: Bivariate Choropleth Map
#47: Range Graded Proportioanl Circle Map
#46: Continuously Graded Proportional Circle Map
#45: Multivariate Map
#44: Star Plot
#43: Parallel Cooridinate Plot
#42: Lorenz Curve
#41: Triangular Plot
#40: Wind Rose
#39: Climographs
#38: Histogram
#37: Box Plot
#36: Stem and Leaf Plot
#35: Population Pyramid
#34: Scatter Plot
#33: Bilateral Graph
#32: Line Graph
#31: Pie Chart
#30: DOQQ
#29: DEM
#28: Unclassed Choropleth Map
#27: Classed Choropleth
#26: DLG
#25: DRG
#24: LIDAR
#23: Isopleth
#22: Isopachs
#21: Isohyets
#20: Isotachs
#19: Isobars
#18: Doppler Radar
#17: Black and White Aerial Photo
#16: Infrared Aerial Photo
#15: Statistical Map
#14: Cartogram
#13: Isoline Map
#12: Hypsometric Map
#11: PLSS Map
#10: Propaganda Map
#9: Mental Map
►
February
(1)
►
January
(7)
About Me
BCausey89
View my complete profile

No comments:
Post a Comment