http://www.census.gov/population/cen2000/map01.gif
Tuesday, April 13, 2010
#15: Statistical Map
http://www.census.gov/population/cen2000/map01.gif
Wednesday, April 7, 2010
#14: Cartogram
A cartogram is a map in which a variable such as population is substituted for land area, the geometry of the map is distorted to convey the information. This particular cartogram is of the United States and shows each county resized based on its population, the colors used are based on the 2004 election popular vote.
http://upload.wikimedia.org/wikipedia/en/4/47/Cartlinearlarge.png
#13: Isoline Map
An Isoline map is one that has continuous lines joining points of the same value, isoline maps can be used to show levels of elevation, temperature, wind speeds, and pressure. This map shows the mean annual precipitation for Mexico, each line moves continuously showing areas with the same amount of rainfall.
http://www.lib.utexas.edu/maps/atlas_mexico/mean_annual_precipitaion.jpg
#12: Hypsometric Map
http://www.reliefshading.com/colors/pictures/hypso_france.jpg
#11: PLSS Map
http://gis.nwcg.gov/giss_2006/job_aids/maps_and_graphics/USA_PLSS_Meridians_map.jpg
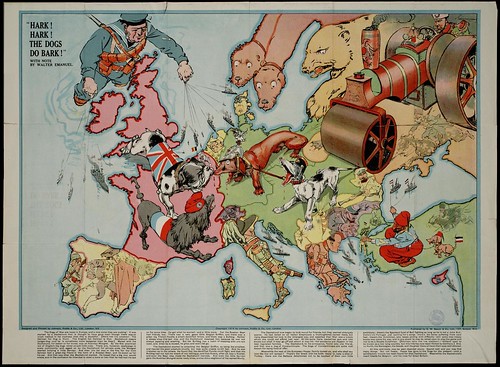
#10: Propaganda Map
http://farm4.static.flickr.com/3281/2722416468_1aebcdebb2.jpg
#9: Mental Map
Mental Maps are based on someones own point of view, they can be very detailed or just a simple drawing like the one to the left. An example of a mental map could be driving directions based on a persons preferred path of travel. This particular map is a persons perception of Coal City, illinois. The map pinpoints places in the city that are particularly memorable to the map maker along with a bit of information on his experiences in each place.
Info from: http://www.uky.edu/~ulack/Geo152/unnumbered%20figure%20pg%2003.jpg
Subscribe to:
Posts (Atom)