skip to main
|
skip to sidebar
Brittany's Map Catalog
Tuesday, April 13, 2010
#16: Infrared Aerial Photo
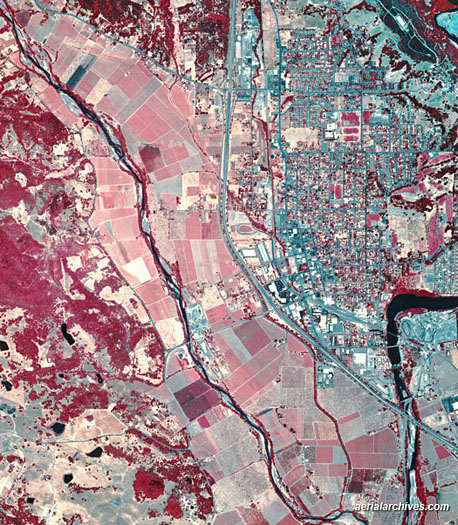
Infrared aerial photos can be used to show changes in the environment, such as the health of forests and oceans. It is also used on farms to detect changes in land and possible diseases or infestations. This map shows land in Sonoma County, Ca.
http://www.aerialarchives.com/stock/img/AHLV2002.jpg
No comments:
Post a Comment
Newer Post
Older Post
Home
Subscribe to:
Post Comments (Atom)
Followers
Blog Archive
▼
2010
(50)
▼
April
(42)
#50: Nominal Area Choropleth Map
#49: Univariate Choroplth Map
#48: Bivariate Choropleth Map
#47: Range Graded Proportioanl Circle Map
#46: Continuously Graded Proportional Circle Map
#45: Multivariate Map
#44: Star Plot
#43: Parallel Cooridinate Plot
#42: Lorenz Curve
#41: Triangular Plot
#40: Wind Rose
#39: Climographs
#38: Histogram
#37: Box Plot
#36: Stem and Leaf Plot
#35: Population Pyramid
#34: Scatter Plot
#33: Bilateral Graph
#32: Line Graph
#31: Pie Chart
#30: DOQQ
#29: DEM
#28: Unclassed Choropleth Map
#27: Classed Choropleth
#26: DLG
#25: DRG
#24: LIDAR
#23: Isopleth
#22: Isopachs
#21: Isohyets
#20: Isotachs
#19: Isobars
#18: Doppler Radar
#17: Black and White Aerial Photo
#16: Infrared Aerial Photo
#15: Statistical Map
#14: Cartogram
#13: Isoline Map
#12: Hypsometric Map
#11: PLSS Map
#10: Propaganda Map
#9: Mental Map
►
February
(1)
►
January
(7)
About Me
BCausey89
View my complete profile
No comments:
Post a Comment