http://mapmaker.rutgers.edu/355/africa_political.gif
Wednesday, April 14, 2010
#50: Nominal Area Choropleth Map
http://mapmaker.rutgers.edu/355/africa_political.gif
#49: Univariate Choroplth Map
#48: Bivariate Choropleth Map
#47: Range Graded Proportioanl Circle Map
#46: Continuously Graded Proportional Circle Map
http://www.neiu.edu/~jrthomas/377/circle.jpg
#45: Multivariate Map
http://cliffspages.info/images/Lab7_Part1.png
#44: Star Plot
Star plots are useful because you can compare a lot of data for many different items. This plot is of some popular vehicles, each color stemming off represents a different variable such as miles per gallon. This plot could be helpful to someone looking to buy a vehicle who wants to compare many attributes of each one.
http://addictedtor.free.fr/graphiques/graphiques/graph_63.png
#43: Parallel Cooridinate Plot
http://stn.spotfire.com/stn/Configure/Images/para_example_1.png
#42: Lorenz Curve
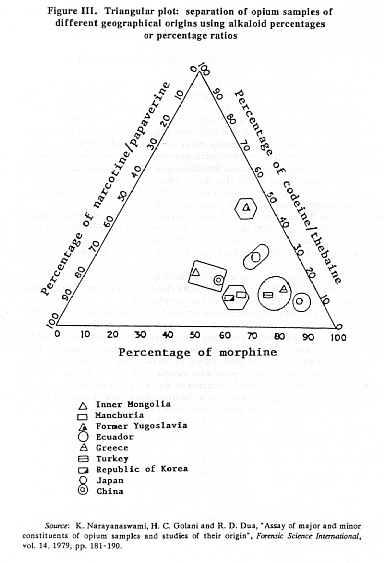
#41: Triangular Plot
http://www.unodc.org/images/odccp/bulletin/bulletin_1994-01-01_2_page008_img003_large.gif
#40: Wind Rose
http://www.climate.washington.edu/windrose/Spokane-WindRose.jpg
#39: Climographs
Climographs show the relationship between temperature and precipitation for a particular place. This graph is of Walgett, Australia; the bars show the amount of precipitation for each month, and the line graph shows the temperature for each month.
http://www.uwsp.edu/gEo/faculty/lemke/geog101/images/09_climograph_BSh.gif
#38: Histogram
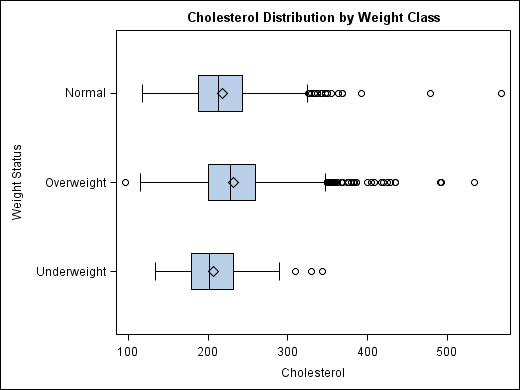
#37: Box Plot
#36: Stem and Leaf Plot
http://www.eduplace.com/math/mhm/5/06a/ts_5_6a_wi-1.gif
#35: Population Pyramid
Population pyramids display age and sex distributions for a given region.This population pyramid is from the 2001 census and shows the populations for the UK. The pink area represents females and the blue is males, each bar represents a different age range.
#34: Scatter Plot
http://www.mzandee.net/~zandee/statistiek/stat-online/chapter4/graphics/age_scatterplot.gif
#33: Bilateral Graph
http://www.treas.gov/press/releases/images/november%20jobs%20graph.jpg
#32: Line Graph
#31: Pie Chart
Pie charts are a type of geovisualization that divides a circle it pieces, such as pieces of pie, where each pieces size varies based on the data it represents. This chart shows how much money people made in 2007 from blogging, each color represents a dollar amount and the size of each piece shows how many people fall into that category.
Subscribe to:
Posts (Atom)