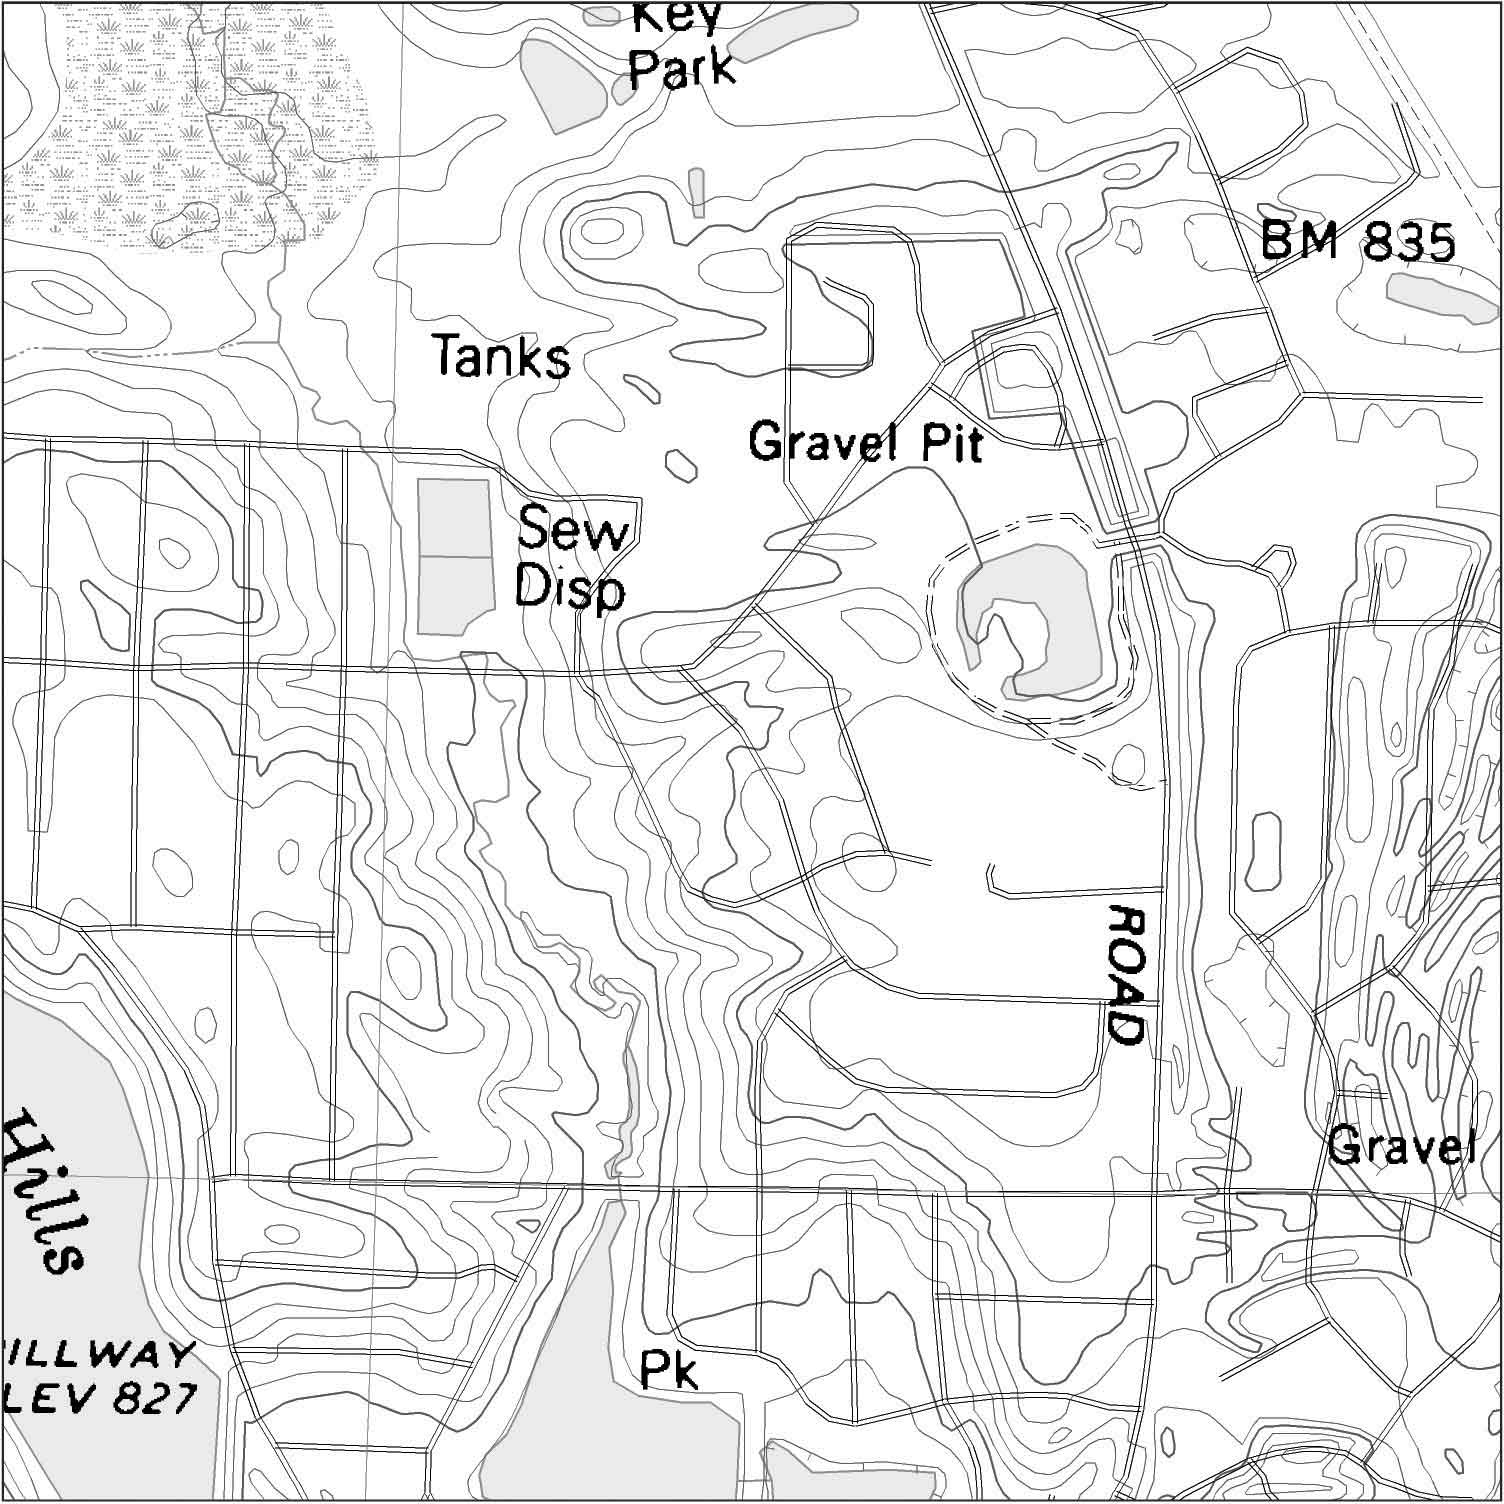
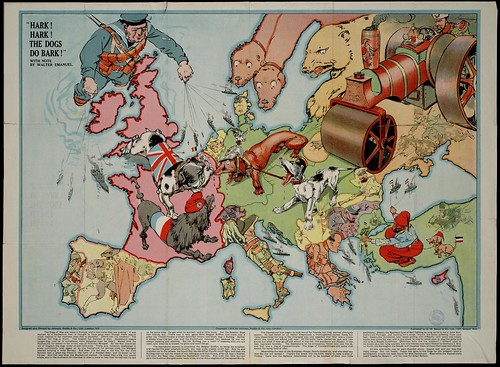
http://mapmaker.rutgers.edu/355/africa_political.gif
Wednesday, April 14, 2010
#50: Nominal Area Choropleth Map
http://mapmaker.rutgers.edu/355/africa_political.gif
#49: Univariate Choroplth Map
#48: Bivariate Choropleth Map
#47: Range Graded Proportioanl Circle Map
#46: Continuously Graded Proportional Circle Map
http://www.neiu.edu/~jrthomas/377/circle.jpg
#45: Multivariate Map
http://cliffspages.info/images/Lab7_Part1.png
#44: Star Plot
Star plots are useful because you can compare a lot of data for many different items. This plot is of some popular vehicles, each color stemming off represents a different variable such as miles per gallon. This plot could be helpful to someone looking to buy a vehicle who wants to compare many attributes of each one.
http://addictedtor.free.fr/graphiques/graphiques/graph_63.png
#43: Parallel Cooridinate Plot
http://stn.spotfire.com/stn/Configure/Images/para_example_1.png
#42: Lorenz Curve
#41: Triangular Plot
http://www.unodc.org/images/odccp/bulletin/bulletin_1994-01-01_2_page008_img003_large.gif
#40: Wind Rose
http://www.climate.washington.edu/windrose/Spokane-WindRose.jpg
#39: Climographs
Climographs show the relationship between temperature and precipitation for a particular place. This graph is of Walgett, Australia; the bars show the amount of precipitation for each month, and the line graph shows the temperature for each month.
http://www.uwsp.edu/gEo/faculty/lemke/geog101/images/09_climograph_BSh.gif
#38: Histogram
#37: Box Plot
#36: Stem and Leaf Plot
http://www.eduplace.com/math/mhm/5/06a/ts_5_6a_wi-1.gif
#35: Population Pyramid
Population pyramids display age and sex distributions for a given region.This population pyramid is from the 2001 census and shows the populations for the UK. The pink area represents females and the blue is males, each bar represents a different age range.
#34: Scatter Plot
http://www.mzandee.net/~zandee/statistiek/stat-online/chapter4/graphics/age_scatterplot.gif
#33: Bilateral Graph
http://www.treas.gov/press/releases/images/november%20jobs%20graph.jpg
#32: Line Graph
#31: Pie Chart
Pie charts are a type of geovisualization that divides a circle it pieces, such as pieces of pie, where each pieces size varies based on the data it represents. This chart shows how much money people made in 2007 from blogging, each color represents a dollar amount and the size of each piece shows how many people fall into that category.
#30: DOQQ
DOQQ (Digital OrthoQuarter Quad) is a type of GIS, it is an aerial photo however it has a uniform scale therefore its measurements are accurate, it is basically a photographic map. DOQQ's may in real color or they can be artificially infrared to show more surface features.
http://data.labins.org/2003/General/gfx/doqq.jpg
#29: DEM
#28: Unclassed Choropleth Map
#27: Classed Choropleth
This is a classed choropleth map of the percent of hispanic and latinos by county in Florida. Each data class has a range of percent that matches with a color, the map shown uses natural breaks. For this map the greater the percentage the darker the shade.http://my.ilstu.edu/~jrcarter/Geo204/Choro/Tom/
#26: DLG
#25: DRG
#24: LIDAR
LIDAR stands for light detection and ranging, it is a type of remote sensing technology that uses scattered light to determine the range to a particular target. LIDAR was used to produce this image of New York City, as you can see shapes and heights of buildings, roads, and even trees can be seen in great detail. This type of technology is often used to create a 3D replica of a particular place.
http://www.noaanews.noaa.gov/stories/images/manhattan-lidar092701.jpg
#23: Isopleth
#22: Isopachs
#21: Isohyets
#20: Isotachs
Isotachs are similar to isobars, however they are continuous lines that attach areas of the same wind speed. This image shows isotachs as well as heights. The solid lines acts a s a topograph in that they connect areas of same height, the dashed lines are the isotachs showing the similar wind speeds.
http://eumetcal.meteo.fr/euromet/resource/nwp/n8400/n8400004.gif
#19: Isobars
#18: Doppler Radar
This Doppler Radar image is of San Antonio during a large hail storm, The areas of red and purple show the areas of highest return, meaning they are where the most rain and and hail are located. Doppler is used by weather services to determine the amount, speed, and direction of rain.
http://media.photobucket.com/image/doppler%20radar/alamocitywx/radar5_2_05-1.png
#17: Black and White Aerial Photo
Tuesday, April 13, 2010
#16: Infrared Aerial Photo
#15: Statistical Map
http://www.census.gov/population/cen2000/map01.gif
Wednesday, April 7, 2010
#14: Cartogram
A cartogram is a map in which a variable such as population is substituted for land area, the geometry of the map is distorted to convey the information. This particular cartogram is of the United States and shows each county resized based on its population, the colors used are based on the 2004 election popular vote.
http://upload.wikimedia.org/wikipedia/en/4/47/Cartlinearlarge.png
#13: Isoline Map
An Isoline map is one that has continuous lines joining points of the same value, isoline maps can be used to show levels of elevation, temperature, wind speeds, and pressure. This map shows the mean annual precipitation for Mexico, each line moves continuously showing areas with the same amount of rainfall.
http://www.lib.utexas.edu/maps/atlas_mexico/mean_annual_precipitaion.jpg
#12: Hypsometric Map
http://www.reliefshading.com/colors/pictures/hypso_france.jpg
#11: PLSS Map
http://gis.nwcg.gov/giss_2006/job_aids/maps_and_graphics/USA_PLSS_Meridians_map.jpg
#10: Propaganda Map
http://farm4.static.flickr.com/3281/2722416468_1aebcdebb2.jpg
#9: Mental Map
Mental Maps are based on someones own point of view, they can be very detailed or just a simple drawing like the one to the left. An example of a mental map could be driving directions based on a persons preferred path of travel. This particular map is a persons perception of Coal City, illinois. The map pinpoints places in the city that are particularly memorable to the map maker along with a bit of information on his experiences in each place.
Info from: http://www.uky.edu/~ulack/Geo152/unnumbered%20figure%20pg%2003.jpg
Wednesday, February 17, 2010
#8: Proportional Circle Map
Tuesday, January 26, 2010
#7: Choropleth Map
Choropleth maps use different colors and shading to depict statistical values if particular areas. This map shows the percentage of the population that is 50 years or older. In 1990 only 0-10% was over 50, it is predicted that by 2030 10-30% of people will be over 50 years old. The scale in the middle shows the percentage range and the correlating colors that will be be seen on the map. info:
http://www.eps.mq.edu.au/courses/GEOS219/choropleth.htm
#6: Dot Distribution Maps
This map is from the U.S. Census Bureau, it represents the population in the United States in 2000 using dot distribution. While you can't tell a specific amount of people you can understand the ratio of were people live most. Each dot represents 7500 people, so the brightest areas have the greatest population.
Info from:
http://www.census.gov/geo/www/mapGallery/2kpopden.html
#5: Cadastral Map
Info from:
http://alamedahistory.org/the-map/
Tuesday, January 19, 2010
#4: Flow Map
info from:
http://mundi.net/maps/maps_014/
#3: Thematic Map
This is a Thematic map based on the population change in the United States from 1990-1996. It is thematic because it focuses on one common theme of the mapped area rather than many different land attributes. It uses a colored code to distinguish different percentage ranges of population increase.
Info from:
http://www.sou.edu/Geography/JONES/GEOG280/sample.htm
Monday, January 18, 2010
#2: Planimetric Map
This is a Planimetric from 1932 of a walled Chinese city and its irrigation system. The map was created by the Japanese Expeditionary forces in Shanghai. The Planimetric map focuses primarily on horizontal features of the shown area, in particular this map is descriptive of the city boundaries, water systems, lakes or ponds, roads, and what seems to be forest areas.
info obtained from:
http://www.loc.gov/rr/geogmap/guide/gmillgen.html
Tuesday, January 12, 2010
#1: Topographic Map
information from:
http://www.mapsofindia.com/maps/india/topographic-map.htm
Subscribe to:
Comments (Atom)
